I have travelled the road from Kiganjo in Nyeri County to Nairobi, many times. At first, I was in secondary school. Afterwards, it was visiting relatives in Othaya, during which trips we would usually turn off towards Mukurweini, soon after Karatina town. Later, and more frequently, while serving as governor of Laikipia.
The road alignment has straightened (Thika-Kenol-Makutano) since I first travelled on it, and improved to a four-lane dual carriageway, now covering the entire length from Marua. The section between Thika and Nairobi is, of course, a much wider highway with four lanes on either side, and six in some sections. Towns along the highway have grown, except Kiganjo which gave way to Chaka.
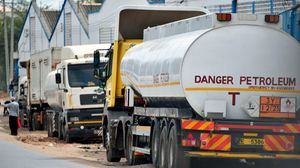
The traffic has increased in my guestimate, by a factor of at least 10 times. One on-line account says 150 percent growth in the last 20 years! And everywhere along the highway, many food and accommodation facilities have come up. Two new towns - Makutano and Kenol – have grown quite quickly, as have settlements at Weteithie, Kahawa Sukari, Kahawa Wendani, and Thome.
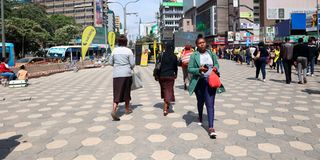
Travelling to the city from Nanyuki last Monday, it stuck me. The visible signs of middle classness all along the route. But it is not just on this route. In Nairobi itself, in Mombasa, Nakuru and Eldoret (now cities), in Mandera, Wajir, and Namanga. It is all over and yet, many citizens feel left behind.
Seeking explanations, I looked at household budgets for insights on real incomes. The Kenya National Bureau of Statistics (KNBS) categorises urban households into three income tiers based on monthly spending.
Official unemployment rate
The lower income spend Sh23,670 or less per month, mainly (65 percent) on food. They are heavily exposed to commodity price spikes and have zero room for savings.
The middle income spend between Sh23,671 and Sh199,999 per month, often relying on digital loans or saccos to pay school fees and rent. Only 15 percent are able to save regularly, leaving the rest highly vulnerable to minor financial emergencies.
The upper income spend Sh200,000 or more per month. They possess disposable income for investments, private insurance, and asset accumulation. They are thus insulated from daily economic shocks.
The “informal” economy dominates employment. Out of the 21.6 million working population, 18.1 million (83.8 percent) are in it, compared to only 3.3 million in the formal sector. However, the latter shoulder the national tax burden, because the informal economy operates outside structured taxation.
The official unemployment rate, (five percent currently) is criticised for masking under-employment because it classifies anyone generating survival income – from boda boda riders, mama mbogas, or digital gig workers as employed. But there is nothing informal about the more than Sh50 trillion moving through mobile platforms annually – is it time to drop the tag?
Consumer purchasing power
Inflation is the big enemy of improving real incomes. It is driven largely by three primary categories. Transport; food and non-alcoholic beverages; and housing, water, electricity and gas account for over 57 percent of total household spending weights. Food includes cooking oil, sifted maize flour, loose maize grains, and vegetables such as Sukuma wiki and cabbages.
Historically, real per capita income was mostly stagnant or declining in the 1980s and 90s. Economic growth was insufficient. It dropped from about 7.2 percent in the 1970s to 4.2 percent in the 1980s and just over two percent in the 1990s. This was below the country's population growth rate. As a result, living standards dropped or remained flat.
Starting in 2003, the economy underwent a notable revival. Real GDP growth accelerated – sustained, sometimes volatile, growth. Services, transport, and manufacturing drove consistent increases in real per capita income, averaging 2-4 percent annually. This significantly boosted consumer purchasing power, lifting a portion of the population out of poverty before to the global health crisis struck.
The Covid-19 disruptions reversed real per capita growth sharply, contracting it by -0.27 percent in 2019/20. The economy rebounded strongly in 2021 with an overall GDP growth of 7.59 percent, and has continued to grow since. Real per capita income has made modest gains. So, what is wrong?
First, inequality. Averages mask extremes. Income has increased the most for the top earners, but only very modestly at the bottom, with regional disparities. Second, the gains from recovery have not yet covered previous declines.
But, me thinks there is reason to hope: per capita real income has increased from $102 in 1960, $402 in 2002, to $2,363 now.
Unlock a world of exclusive content today!Unlock a world of exclusive content today!