Time flies with great content! Renew in to keep enjoying all our premium content.
Prime
Kenya’s economic growth crisis: Wins and woes for devolution
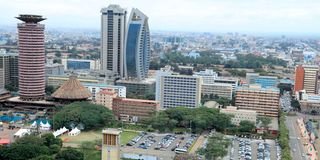
The skyline of Nairobi CBD on June 23, 2021. The CAIPS aim to help Kenya reverse its reliance on imports, shifting from 80 percent imported consumption to greater local production.
While Madaraka Day podiums on June 1, 2025, waxed on Kenya’s socio-economic achievements, alarms sounded from the World Bank on surging debt potentially catastrophic for Kenya; the African Development Bank (AfDB), my former employer, published its growth outlook for 2025/26.
East Africa is growing fastest in Africa at 5.9 percent. Ethiopia, Rwanda, Djibouti, Uganda and Tanzania lead growth. Kenya is relegated.
What eviscerates Kenya’s performance? The failures are known: spending and borrowing Kenya to bankruptcy in a harrowing addiction to loans (commitment fees for unused loans reached Sh6.6 billion as the Auditor General recently reported to Parliament), public finances wrecked by embezzlement with free education on the brink of collapse, disposal or weakening of family jewels vital for growth, inhumane frittering of NHIF monies, a backfooted and muddled housing levy initiative funded with pay-slip taxation, spent largely on Treasury Bills and bonds. Then, devolution.
Is the second-tier government, fronted in pursuit of affirmative action and inclusivity, a vital conduit of collapse in growth? Kenya transferred power, resources, and representation from national government to counties in the 2010 Constitution.
The Kenya National Bureau of Statistics (KNBS) issues the Gross County Product (GCP) showing county performances. This is unique in Sub-Saharan Africa for evidence-based measures tracking the pulse of the economy at sub-national level- county output, sector shares, employed persons etc.
From a decade and a half of devolution, massive resources transferred to counties still leave them in crisis asking for more, spearheaded by the Council of Governors (CoG). Yet, a widespread joblessness leaves over 80 percent of Kenya’s labour force unemployed or in the informal sector, while devolved spending narrows output and widens inequality.
Representation of counties with high-growth performance is so deeply flawed as to suggest overall anti-growth results from inequalities in County revenue allocations. Even if counties with low shares of GCP were to lead the charge to Kenya’s growth recovery, would their shares in contributions restore Kenya in the league of top performers on the continent?
Yet, use of resources allocated for devolved functions already poses dire questions, let alone lagging economic impact. Spending spills into county pending bills, bank borrowing and ghost projects giving nationwide headaches to Ethics and Anticorruption Commission (EACC).
This has not stopped the CoG from periodically wearing iconic western fashion pieces or splendid kitenges, at conferences celebrating achievements of devolution, where governors smugly duck contrary evidence by experts and government institutions- the KNBS, the Auditor General and the Office of Controller of Budget (OCB).
The next jamboree is the Devolution Conference slated for Homa Bay County during August 2025.
The heart of the drive to restore Gross Domestic Product (GDP) growth in Kenya is prioritised, accountable, and balanced spending on consumption, the fiscal side, business investment and healthy external trade accounts, all repurposed for growth.
The CoG should more constructively interrogate the evidence-based information of KNBS, Auditor General and OCB, all flashing red lights for Kenya’s growth and future?
KNBS data shows the performance of a mere 11 counties (only 23.4 percent of the 47 counties) accounted for 60.9 percent of Kenya’s GDP.
In contrast, 36 county economies (76.6 percent of 47 counties) accounted for just 39.1 percent of GDP shares. The bottom cluster of 11 counties contributed a bare 5.6 percent of GDP on average.
They are West Pokot (0.7 percent), Taita Taveta (0.6 percent), Garissa (0.6 percent), Marsabit (0.6 percent), Tharaka Nithi (0.6 percent), Wajir (0.5 percent). Mandera (0.5 percent), Tana River (0.3 percent), Lamu (0.3 percent), Isiolo (0.3 percent) and Samburu (0.3 percent).
Kenya’s work population of 20 million in the counties tracks the same imbalances as the contributions to GDP. Nairobi, Kiambu and Nakuru lead at work. Notably the lowest levels of working populations are in counties such as Lamu, Isiolo and Samburu, underpinning their low output. The same patterns occur in poverty estimates showing it persists in counties with low GDP shares.
Revenue allocation
Public spending (vital for sparking growth, given its place in consumption, public/private investments, and net-exports), is similarly lop-sided. Why does this matter? In the expenditure approach to GDP accounting, fiscal spending technically induces fiscal multiplier effects.
Yet, reports of the Auditor General and OCB repeatedly flag horrific leaks and inefficiencies: little in development allocations is spent, and even that is patchy and intermittent, without proportionate results.
Development spending is in any case widely cannibalised from stipulated percentages of allocations (35 percent) to increase recurrent spending in almost all counties, especially travel and allowances.
Data shows the lowest spenders on development allocations were also among the lowest contributors to GDP -output: Lamu (Sh 7.4 billion), Taita Taveta (Sh 9.7 billion), Tharaka Nithi (Sh10.8 billion), Vihiga (Sh11.8 billion), Kirinyaga (Sh12.4 billion) and Elgeyo Marakwet (Sh12.4 billion). Unaccounted amounts- suspected of fueling corruption- repeatedly raise the interest of EACC.
Reform of allocations to prioritise county GCP growth, sector growth, employment, reduced poverty, anti-corruption, and less dependency, are primary imperatives for national and county governments in re-purposing growth. Not redistribution that impoverishes all.
How is the gravy train of allocations partitioned among the Counties? An example of data-based evidence that breaks down both recurrent and development spending is the OCB citation above. Allocations when repartitioned as per capita amounts in the counties suggest a disconnect among Kenya’s top economic growth clusters and low-performing clusters.
Compare allocations to low GDP contributors, not to speak of the Equalisation Funds allocated for affirmative action, restricted to that cluster to address socio-economic disparities from Kenya’s time of colonial rule. The biases in allocations (and thus in spending which is computed into per capita income transfers to the Counties, show that low GCP contributors predominate in the h ighest per capita income transfers.
Between them, 11 low-output Counties are the top beneficiaries of per capita revenue allocations and receive between Ksh21,000- Ksh12,000 in allocations.
The Counties are Lamu (Ksh21,000), Samburu (Ksh18,000), Isiolo (Ksh17,000), Taita Taveta (Ksh17,000), Marsabit (Ksh15,000), Turkana (Ksh14,000), Mandera (Ksh12,000), Tharaka Nithi (Ksh12,000), Wajir (Ksh12,000), and Laikipia (Ksh12,000).
The above allocations contrast with the low levels of per capita income transfers to the top County contributors to Kenya’s GDP. The 12 Counties with high-GCP contributions that are negatively affected receive per capita allocations between Ksh7,000-4,000).
They are Kisumu (Ksh7,000), Trans Nzoia (Ksh7,000), Kilifi (Ksh7,000), Kakamega (Ksh7,000), Meru (Ksh7,000), Migori (Ksh7,000), Bungoma (Ksh7,000), Siaya (Ksh6,000), Machakos (Ksh6,000), Kisii (Ksh6,000) Nakuru (Ksh6,000) and Kiambu (Ksh4,000). Note the list of 12 lowest per capita income recipients feature 7 of the top GCP contributing Counties of Fig. 1: Kisumu, Kilifi, Kakamega, Meru, Machakos, Nakuru, and Kiambu (the 2nd top GCP performer, taking the tail-end of per capita allocations at Ksh4000.
Dr Mbui Wagacha is former acting chair CBK, and Senior economic adviser, Executive Office of the President
Unlock a world of exclusive content today!Unlock a world of exclusive content today!